| |||||
| Read the Graph 8 For Google Apps | |||||
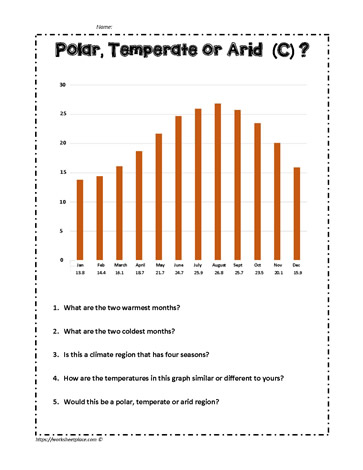
| Reading data on a graph is so much easier than reading the words. This graph shows a polar, temperate or arid climate. By looking at the stats determine which type it is. How does it compare to the climate where you live? | |||||

All worksheets are created by experienced and qualified teachers. Send your suggestions or comments.